Summary
What happens if you split a portfolio evenly between a 2x leveraged Nasdaq-100 ETF and its unleveraged counterpart, then rebalance once a quarter? Over nearly 20 years of backtesting, $100,000 grew to $4.66 million — a 21.3% annualized return — while shedding roughly a quarter of the volatility you'd suffer holding the leveraged fund alone. The blend isn't a free lunch (a 71% peak drawdown will test anyone's resolve), but it's a surprisingly effective way to capture most of leverage's upside without the full downside.
Research Objective
Leveraged ETFs have a reputation problem. The standard warning is that they're "only for day trading" because daily reset mechanics cause them to decay over time, especially in choppy markets. But that story is incomplete. In a market with a strong long-term upward drift — like the Nasdaq-100 — leverage can compound powerfully if you manage the risk.
The question here is straightforward: can you get meaningfully more return than a plain Nasdaq-100 index fund by blending in a 2x leveraged version, without taking on the catastrophic drawdown risk that comes with going all-in on leverage? And can you do it with a strategy simple enough that a normal person would actually stick with it?
Methodology
The backtest runs from June 21, 2006 (QLD's inception) through May 1, 2026 — just shy of 20 years. That window includes the 2008 financial crisis, the COVID crash, the 2022 bear market, and two extended bull runs. It's about as thorough a stress test as recent market history allows.
The portfolio:
- 50% in QLD (ProShares Ultra QQQ — a 2x daily leveraged Nasdaq-100 ETF)
- 50% in QQQM (Invesco Nasdaq-100 ETF — an unleveraged Nasdaq-100 tracker)
Since QQQM only launched in October 2020, the backtest uses QQQ as a proxy for the earlier years. The two track the same index; the only difference is QQQM's slightly lower expense ratio (0.15% vs. 0.20%), which makes negligible difference over this analysis.
Rebalancing rule: Once per quarter, on the first trading day of each calendar quarter, reset the allocation back to 50/50. That's it — 81 rebalances over the full period, roughly one every three months. No signals, no indicators, no judgment calls.
What this doesn't account for: Transaction costs, taxes on rebalancing, and any bid-ask spread friction. In practice these would reduce returns modestly, but with only four trades a year in highly liquid ETFs, the drag is small.
Data source: Yahoo Finance adjusted daily closing prices. All returns include dividends.
Findings
The headline numbers
| Metric | 50/50 Blend | QLD Only | QQQM Only |
|---|---|---|---|
| Total Return | 4,557% | 8,300% | 1,936% |
| CAGR | 21.3% | 25.0% | 16.4% |
| Annualized Volatility | 32.6% | 43.9% | 22.0% |
| Sharpe Ratio (rf = 4%) | 0.53 | 0.48 | 0.56 |
| Max Drawdown | −71.0% | −83.1% | −53.4% |
The blend's 21.3% CAGR sits much closer to QLD's 25.0% than to QQQM's 16.4%. That asymmetry is the interesting part — you're giving up only 3.7 percentage points of annual return while cutting volatility by over 11 points. The Sharpe ratio (a measure of return per unit of risk) improves from 0.48 to 0.53, which means each unit of risk you're taking is working harder.
The rebalancing bonus
Quarterly rebalancing isn't just a risk-management tool here — it actually adds return. This is the classic "volatility harvesting" or "rebalancing bonus" effect. When QLD surges, it becomes an outsized share of the portfolio, and rebalancing trims it. When QLD crashes, it shrinks, and rebalancing buys more. Over time, this systematic buy-low-sell-high pattern compounds meaningfully.
You can see this in the numbers: a static 50/50 blend with no rebalancing would drift toward whichever asset performed better recently, losing the diversification benefit exactly when you need it most. Quarterly resets keep the exposure disciplined.
Year-by-year returns
| Year | 50/50 Blend | QLD | QQQM |
|---|---|---|---|
| 2007 | +24.1% | +29.0% | +19.0% |
| 2008 | −59.2% | −72.9% | −41.7% |
| 2009 | +85.4% | +121.2% | +54.7% |
| 2010 | +29.1% | +36.9% | +20.1% |
| 2011 | +2.2% | +0.0% | +3.5% |
| 2012 | +26.9% | +34.8% | +18.1% |
| 2013 | +58.1% | +82.1% | +36.6% |
| 2014 | +28.1% | +37.6% | +19.2% |
| 2015 | +12.2% | +14.7% | +9.4% |
| 2016 | +8.6% | +10.0% | +7.1% |
| 2017 | +50.7% | +70.3% | +32.7% |
| 2018 | −3.5% | −8.3% | −0.1% |
| 2019 | +59.6% | +81.7% | +39.0% |
| 2020 | +71.1% | +88.9% | +48.4% |
| 2021 | +40.6% | +54.7% | +27.4% |
| 2022 | −47.7% | −60.5% | −32.6% |
| 2023 | +84.9% | +117.7% | +54.9% |
| 2024 | +34.1% | +42.8% | +25.6% |
| 2025 | +25.9% | +30.4% | +20.8% |
| 2026 YTD | +13.9% | +17.3% | +9.9% |
A few things jump out:
- The bad years hurt, but they're survivable. 2008's −59% and 2022's −48% are brutal — but compare them to QLD alone (−73% and −61%). That's the difference between "painful" and "potentially career-ending."
- Recovery years are explosive. The blend returned +85% in 2009 and +85% in 2023 — fast enough to claw back the prior year's losses and then some.
- There are no lost decades. Even including the GFC, the blend was positive in 16 of 20 years.
The drawdown reality
The worst peak-to-trough decline was −71.0%, occurring during the Global Financial Crisis (bottom: March 9, 2009). That's a gut-wrenching number. To put it concretely: a portfolio worth $200,000 at the 2007 peak would have been worth about $58,000 at the bottom.
For comparison, QLD alone drew down 83% — meaning a $200,000 portfolio would have shrunk to $34,000. And QQQM saw a 53% drawdown. The blend sits between the two, closer to the middle.
The 2022 drawdown (−48%) was the second-worst episode. Notably, the recovery from both major drawdowns was swift — the blend's leveraged component acts as an accelerant on the way back up, just as it amplifies losses on the way down.
Growth chart
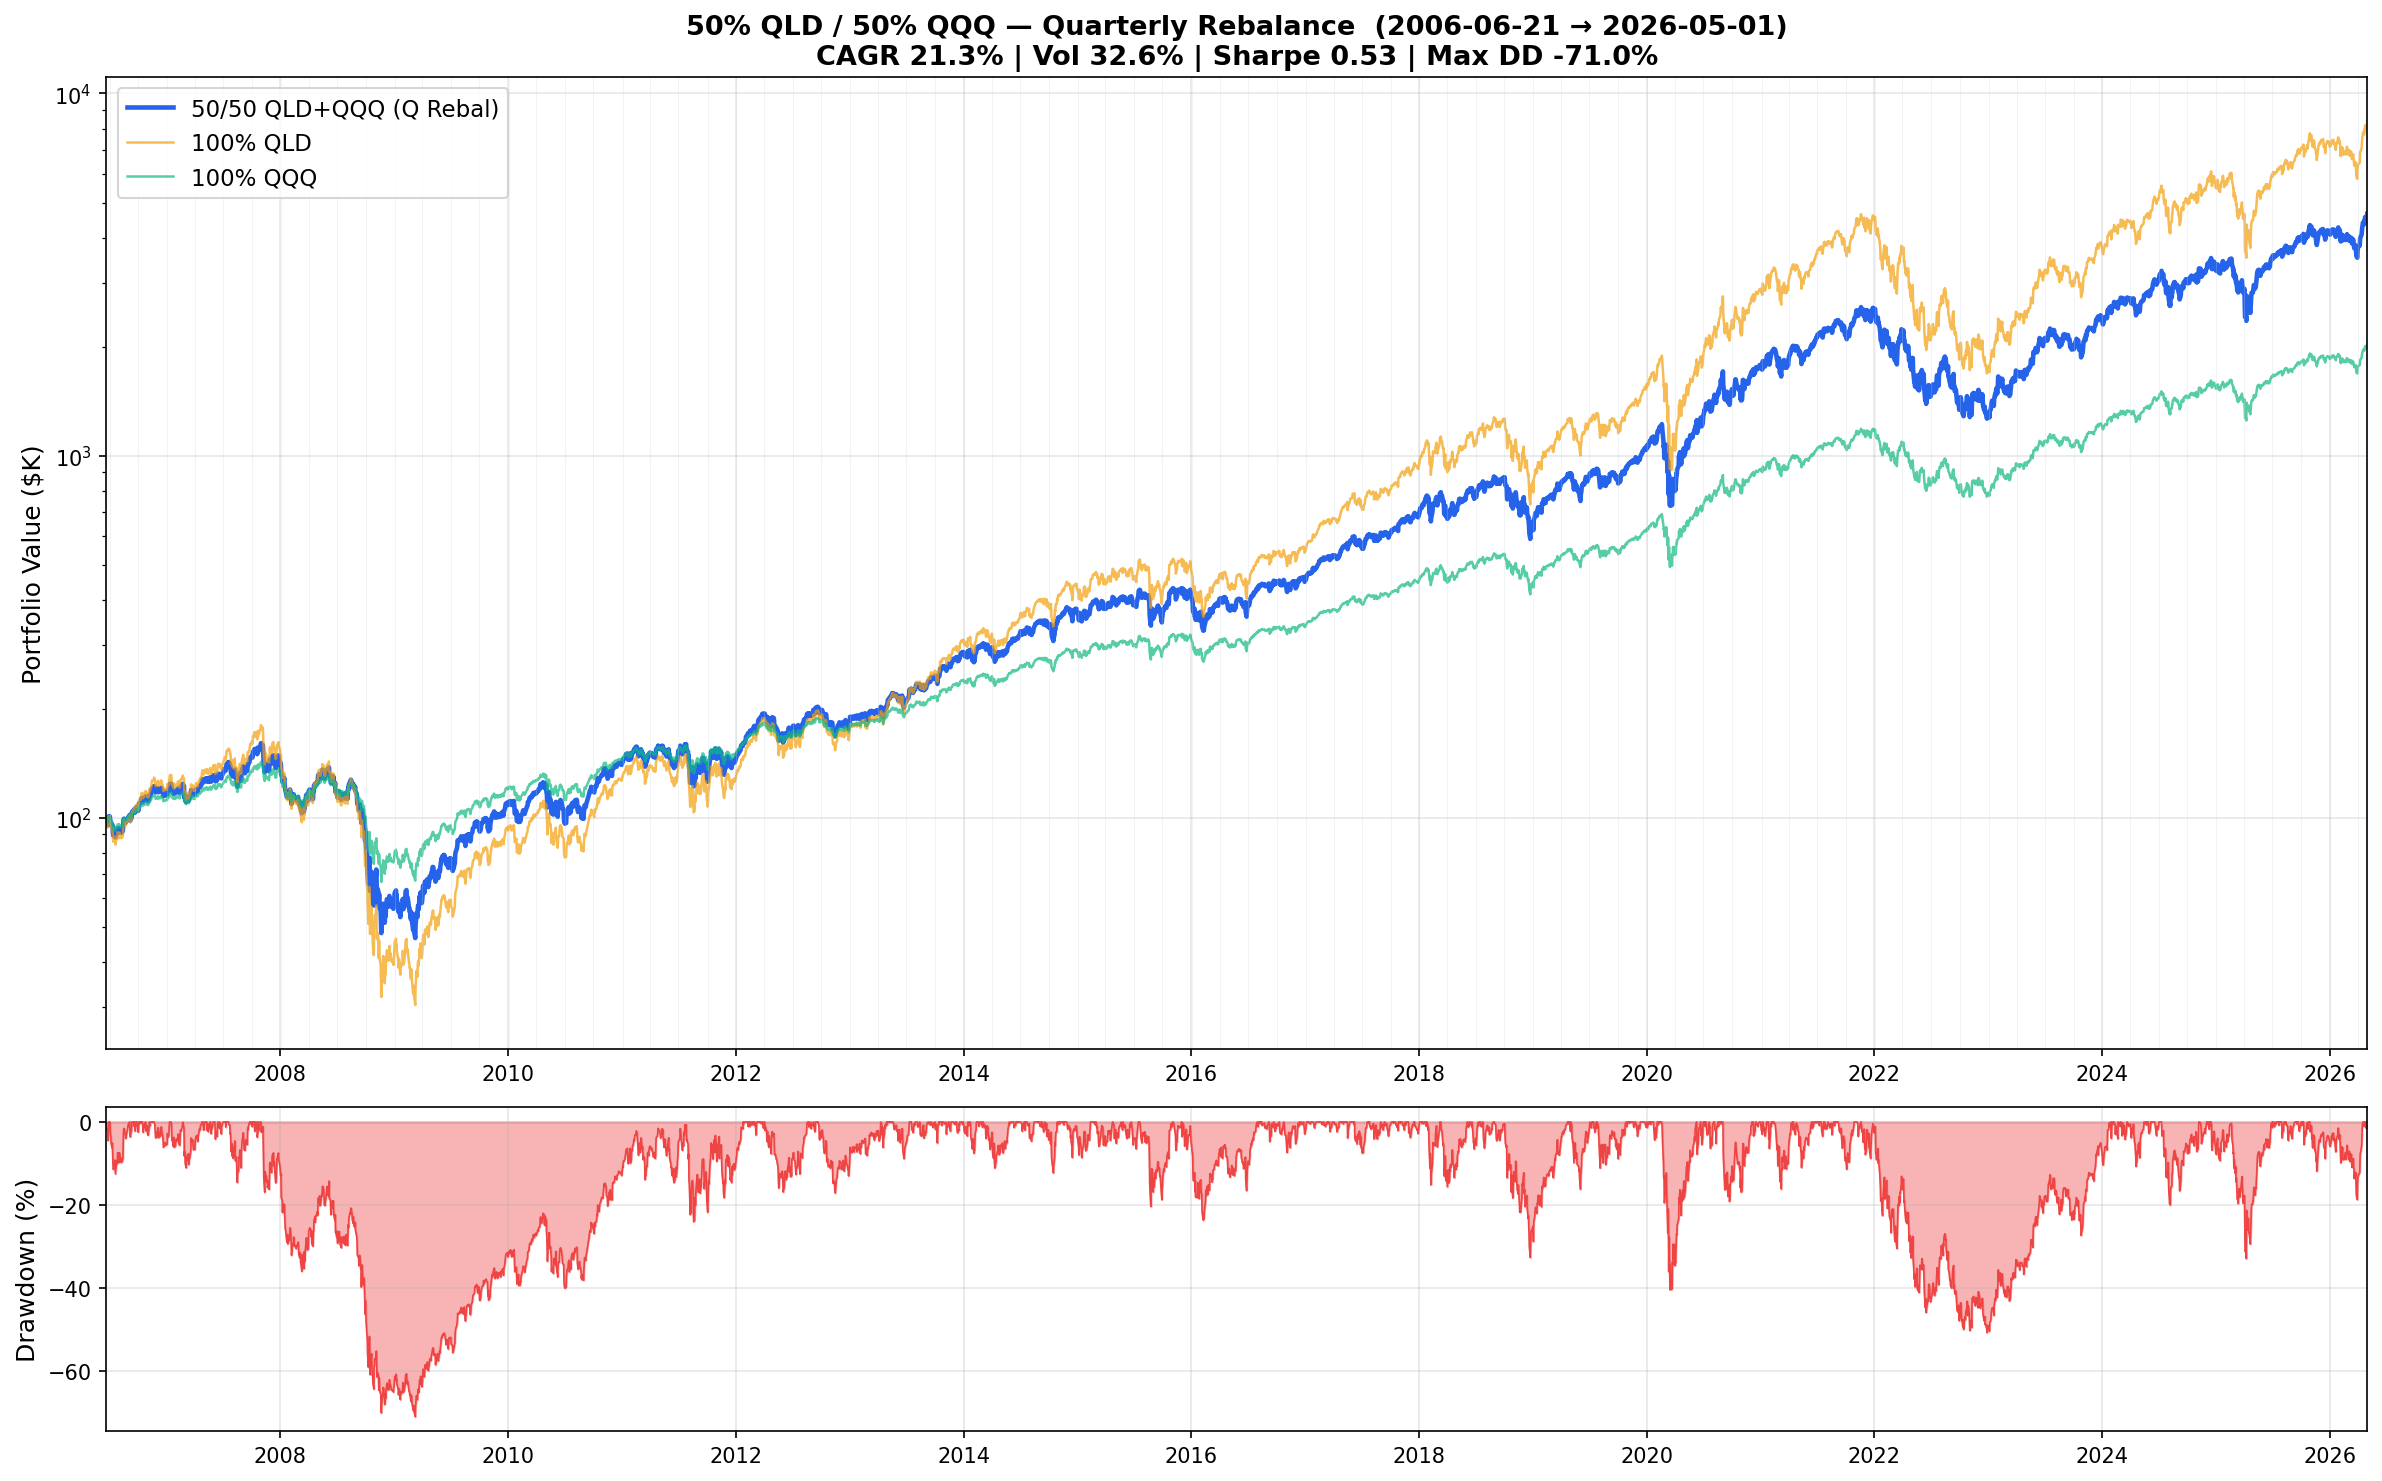
The log-scale chart tells the story clearly. The blend (blue) hugs closer to QLD (orange) during bull markets and closer to QQQM (green) during bears. That's exactly the asymmetry you want — participating in the upside while getting partial shelter on the downside. The drawdown panel at the bottom shows the three major stress events (2008–2009, 2020, 2022) and how the portfolio recovered from each.
"You're giving up only 3.7 percentage points of annual return while cutting volatility by over 11 points — each unit of risk works harder."
Advice & Conclusion
This strategy works because of a simple structural fact: the Nasdaq-100 has a strong long-term positive drift, and 2x leverage amplifies that drift more than it amplifies the cost of volatility. The unleveraged half acts as a shock absorber, and quarterly rebalancing systematically harvests the spread between the two.
Who this is for: Investors with a long time horizon (10+ years), genuine tolerance for large drawdowns, and the discipline to rebalance mechanically during panics — which is, honestly, the hardest part. Watching your portfolio drop 50–70% and then buying more of the thing that's falling requires conviction that most people overestimate in themselves.
Who this is not for: Anyone who might need the money within 5 years, anyone who would panic-sell during a crash, or anyone managing money where a 50%+ drawdown would have real-life consequences (retirement funds, near-term obligations).
Practical notes:
- Rebalancing frequency doesn't need to be exact. Quarterly is a sensible default. More frequent rebalancing (monthly) adds marginal benefit but increases trading friction and tax events. Less frequent (annually) still captures most of the effect.
- Tax efficiency matters. In a taxable account, quarterly rebalancing generates short-term capital gains. This strategy is most tax-efficient in a tax-advantaged account (IRA, 401k).
- The 50/50 split is a starting point, not gospel. A more conservative investor might prefer 40% QLD / 60% QQQM; a more aggressive one might go 60/40. The key insight — that blending leverage with its unleveraged counterpart and rebalancing can improve risk-adjusted returns — holds across a range of weights.
The open question is whether the next 20 years of the Nasdaq-100 will look anything like the last 20. This strategy is a bet on continued long-term growth in large-cap technology and innovation. If the Nasdaq-100 enters a prolonged secular bear market or a decade of sideways chop, the leveraged component will decay more than it compounds, and the blend will underperform plain QQQM. The historical record is encouraging, but it's one sample path — not a guarantee.
Twenty years of data, including two of the worst bear markets in modern history, suggest that the blend is a robust approach to capturing leveraged upside with managed risk. The hard part isn't the strategy. The hard part is sticking with it.