Summary
By the close of April 2026, the S&P 500 sat above 7,200 — a fresh record, and a near-30% climb from a year earlier. A lot of investors were still watching from the sidelines, half-convinced that buying at an all-time high is a recipe for regret. We checked 76 years and 19,205 trading days of S&P 500 history to see whether that intuition holds up. It does not: at every horizon longer than six months, buying at a record has matched or beaten buying after a pullback — with lower volatility and shallower worst-case losses. The headline lesson is the unfashionable one: a record close is, on average, an unremarkable place to deploy capital, and a worse place to sit out.
Research Objective
The central question is simple, and a little unfashionable: across a long stretch of market history, has buying when the S&P 500 closes at a new all-time high actually been worse than waiting for a pullback?
It is worth asking because the instinct says yes, and the instinct moves real money. After February's tariff-driven selloff, retail buying collapsed to roughly the 10th percentile (the bottom tenth of historical readings) and only began drifting back in late April, by which point the index had already retraced most of the loss and printed a string of records. The same script repeats every cycle: a correction shakes the marginal buyer out of the market, the recovery happens without them, and once the index is back at highs they freeze. If "wait for a pullback" is the wrong heuristic (the wrong rule of thumb), it would be useful to know.
Methodology
We loaded daily closing prices for the S&P 500 from January 2, 1950 through April 30, 2026 — 19,205 trading days. For each day, we flagged it as an all-time high (ATH) if its close equalled or exceeded the running maximum to date. We then measured forward returns over seven holding periods: 1, 3, and 6 months, and 1, 3, 5, and 10 years. Multi-year results are reported as annualized CAGR (compound annual growth rate — the steady yearly rate that would produce the same total return over the period) so the numbers compare cleanly against the kind of charts most retail investors actually see.
To answer the obvious follow-up — "fine, but isn't a dip a better entry?" — we also bucketed every trading day by its drawdown (the percentage decline from the prior all-time high on the day of purchase) and computed the 5-year forward CAGR for each bucket.
A few honest limits up front: we use the price index, not total return (including dividends would tilt the comparison slightly further toward ATH buys, since dividend yield is roughly stable across regimes); we did not model transaction costs, slippage, or taxes; and the analysis covers the S&P 500 only. None of those change the direction of the result, but they are worth keeping in mind.
Findings
All-time highs are not exceptional
Of the 19,205 days in the sample, 1,521 — about 7.9% — closed at a new high. On any random trading day, the index had roughly a one-in-thirteen chance of setting a record. The "rare" all-time high turns out to be the ordinary state of a healthy market.
Forward returns favor the record
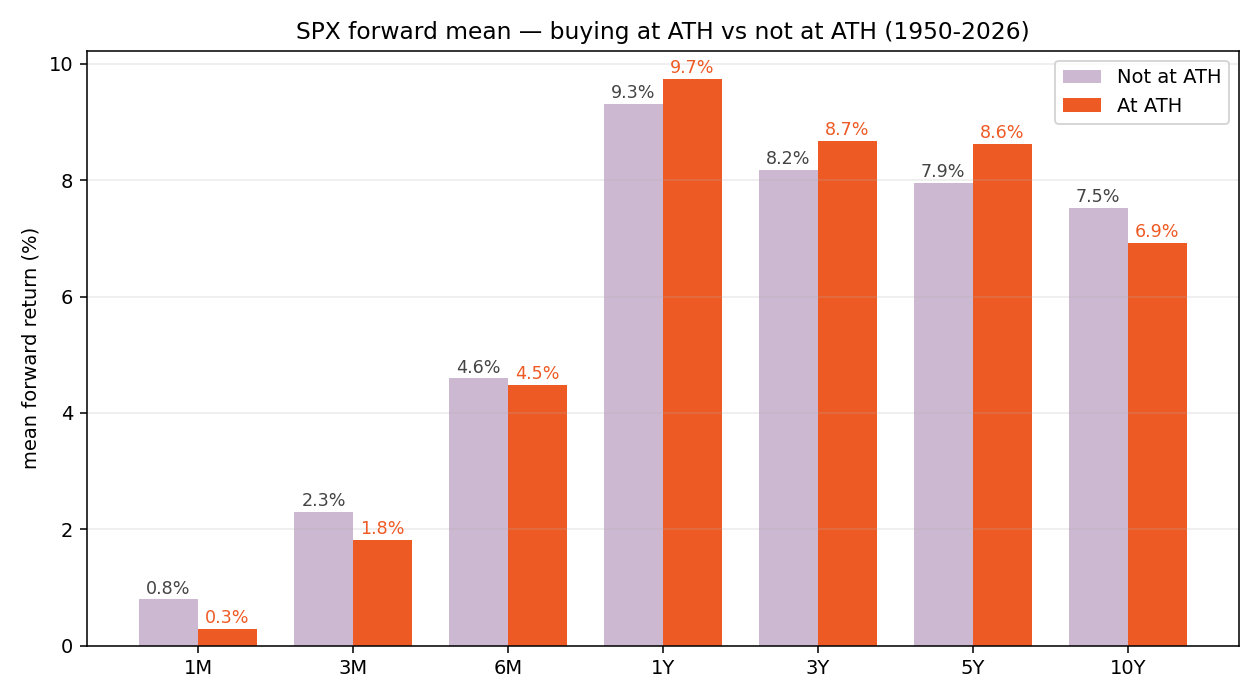
| Horizon | Not ATH (mean) | ATH (mean) | Diff (pp) | Win % (Not ATH) | Win % (ATH) |
|---|---|---|---|---|---|
| 1M | 0.80% | 0.29% | −0.51 | 61.9% | 60.5% |
| 3M | 2.30% | 1.81% | −0.48 | 66.5% | 68.8% |
| 6M | 4.59% | 4.49% | −0.11 | 70.2% | 75.4% |
| 1Y | 9.32% | 9.73% | +0.42 | 74.5% | 74.2% |
| 3Y (ann.) | 8.17% | 8.67% | +0.50 | 85.2% | 90.0% |
| 5Y (ann.) | 7.95% | 8.62% | +0.67 | 83.8% | 86.8% |
| 10Y (ann.) | 7.52% | 6.92% | −0.60 | 93.4% | 89.5% |
Read across the table. At one and three months, ATH buys lose by about half a percentage point — pullbacks really do produce a small bounce. At six months the two are essentially tied. From one year through five years — the horizons where capital actually compounds — buying at a record wins by 0.4 to 0.7 percentage points annualized, with a noticeably higher win rate (90% vs. 85% at three years; 87% vs. 84% at five).
Only the 10-year column flips the other way, and that gap is driven almost entirely by a small cluster of records printed in 1968–72, 1999–2000, and 2007 — the peaks immediately preceding extended bear markets. We come back to that caveat below.
The counterintuitive part: lower volatility, shallower worst case
The sharpest result in the study is not in the means — it is in the risk columns. Forward-return volatility, at every horizon out to one year, is materially lower for ATH days than for non-ATH days. The bottom decile (the worst 10% of outcomes) is also less bad.
| Horizon | Std Dev (Not ATH) | Std Dev (ATH) | Worst-decile (Not ATH) | Worst-decile (ATH) |
|---|---|---|---|---|
| 1M | 4.39% | 3.36% | −4.44% | −3.74% |
| 3M | 7.40% | 5.95% | −6.78% | −4.80% |
| 6M | 10.92% | 8.06% | −9.04% | −5.95% |
| 1Y | 15.98% | 14.18% | −12.26% | −9.81% |
| 3Y (ann.) | 8.48% | 8.19% | −3.18% | −0.08% |
| 5Y (ann.) | 6.65% | 6.66% | −1.57% | −2.26% |
A six-month forward return after an ATH close has a standard deviation (a measure of how widely outcomes are scattered) of 8.1%; the corresponding figure after a non-ATH close is 10.9%. At one year, the worst decile of ATH-buy windows lost 9.8% on average, versus 12.3% for non-ATH-buy windows. The story repeats at three years: the worst decile of ATH-buy outcomes is essentially flat, against a 3.2% annualized loss for non-ATH outcomes.
The mechanism is not mysterious. ATHs cluster in low-volatility, trending bull regimes — exactly the conditions where forward dispersion is also low. The familiar warning that "buying near the top is dangerous" confuses the visible drama of the eventual top with the average experience of buying near it.
"Buying at a record has produced returns at least as good as buying when the market isn't — with lower volatility and shallower worst-case losses."
The mirror finding: buying the dip is overrated
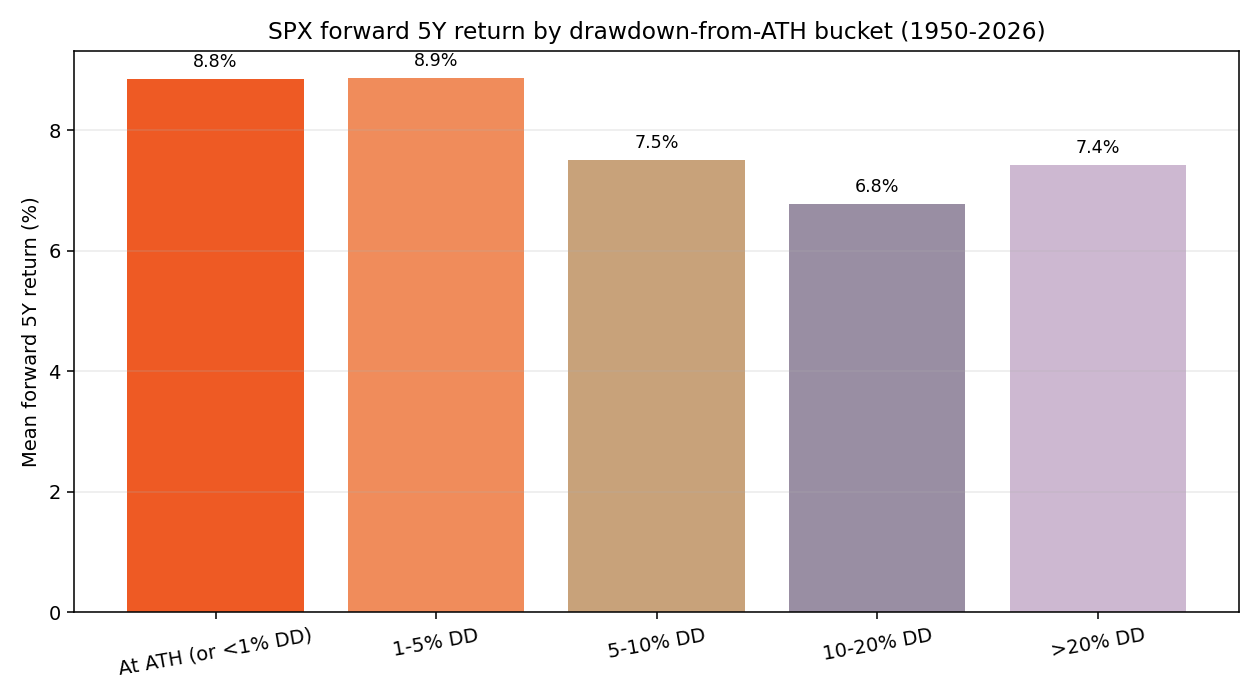
If a record isn't the worst time to buy, what is? We bucketed every trading day by its drawdown from the prior ATH at the time of purchase, then computed the 5-year annualized forward return for each bucket.
| Drawdown at entry | n | Mean 5Y CAGR | Win rate (5Y) |
|---|---|---|---|
| At ATH or <1% drawdown | 3,672 | 8.85% | 87.7% |
| 1–5% drawdown | 4,921 | 8.87% | 84.4% |
| 5–10% drawdown | 2,880 | 7.51% | 79.5% |
| 10–20% drawdown | 3,444 | 6.76% | 83.4% |
| >20% drawdown | 3,028 | 7.42% | 84.3% |
On a five-year view, the worst entries weren't records — they were shallow-to-moderate 5–20% pullbacks. ATH and minor pullbacks (under 5%) tied for first at roughly 8.9% annualized. Only deep, capitulation-grade declines greater than 20% started to claw back toward the top of the table, and even those didn't beat the ATH bucket.
This is the most uncomfortable finding for the "I'll wait for a pullback" instinct. Most pullbacks are exactly the shallow 5–15% variety — the kind that don't materially improve forward returns relative to deploying capital at the prevailing level, and on a five-year view mildly hurt them. The deep buys that do work are rare, terrifying, and almost never accumulated by sidelined retail.
Where the rule breaks: the 1970s and the 2000s
The rule has two genuine exceptions, and both reward attention rather than dismissal. In the 1970s, ATH-buy windows produced a −9.3% mean 1-year return; in the 2000s, −20.5%. Both decades sat just past long bull markets that had pushed the index to its peak before the macro backdrop broke — the 1968–72 "nifty-fifty" top, and the 1999–2000 dot-com top. ATH days clustered around those peaks; the windows that followed were brutal.
But notice the sample size: only 35 ATH days in the entire 1970s, and 13 in the 2000s. For most of both decades, the index sat below its prior peak, so the "ATH-buy disaster" applied to a thin sliver of the sample. The decades with the most ATH days — the 1950s and 1990s — both showed positive ATH-buy alpha (excess return) versus non-ATH buys, consistent with the long-term aggregate.
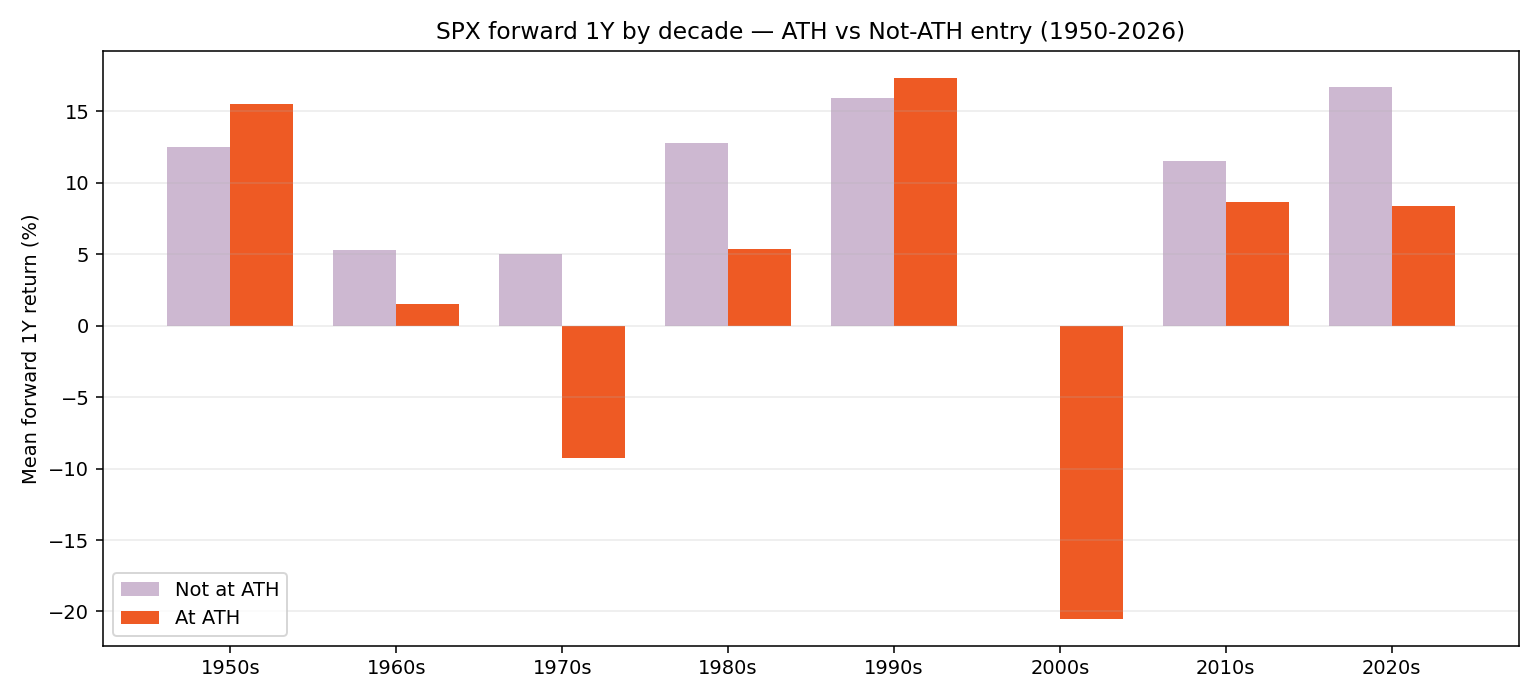
The lesson is not "fear records." It is that records printed just before a regime change are dangerous, and telling those apart from healthy-trend records is the job of a regime-aware system, not a one-line rule of thumb. An investor who avoided ATH buying reflexively from 1950 to 2026 underperformed; an investor who avoided it only when a regime model flagged structural risk did considerably better. There is no version of the data in which a blanket "wait for a pullback" beats either.
Advice & Conclusion
If you sold during February's tariff shock and have been waiting for the "right" re-entry, the data suggests you are fighting the wrong battle. The market is at a record, but every prior record was, most of the time, followed by another record six months, a year, and three years later. The exceptions weren't "ATH days" — they were regime breaks.
If you genuinely believe a regime break is imminent, sit out — that is a defensible thesis. But "the market is at all-time highs" is not, by itself, evidence for that thesis. It is evidence the market is healthy. Three things follow:
- Stop fearing the top. At any horizon longer than six months, ATH buys have matched or beaten non-ATH buys on average, with lower volatility and better worst-case outcomes. Sitting in cash because "the market is at all-time highs" has been a costly heuristic since 1950.
- Don't celebrate the dip. Shallow drawdowns of 5–20% historically delivered the worst 5-year CAGR. Only deep, capitulatory drawdowns greater than 20% start to look attractive — and even those don't beat ATH buys over five years.
- The tail risk is regime change, not the record itself. The ATH-buy disasters of the 1970s and 2000s were not random — they were records printed immediately before structural macro breaks. A sound process watches the regime, not the price level.
A few open questions worth their own studies. How to spot a regime break in real time is the hard problem the 1970s and 2000s leave on the table. How the picture shifts once dividends, taxes, and trading costs are layered in is the next obvious extension — price-index ATH buys would look modestly better on a total-return basis, but the marginal effects depend on holding period and tax regime. And whether the same pattern holds outside the S&P 500 (cluster bias means ATH days disproportionately come from extended bull runs, so the comparison is partly between low-vol bull regimes and mixed regimes) is worth its own treatment. None of those changes the directional conclusion of this study: at the horizons that matter for long-term capital, a record close is, on average, an unremarkable place to buy — and a worse place to sit out.